

CARTITUDE-4 Follow-Up Analysis
Depth of Response
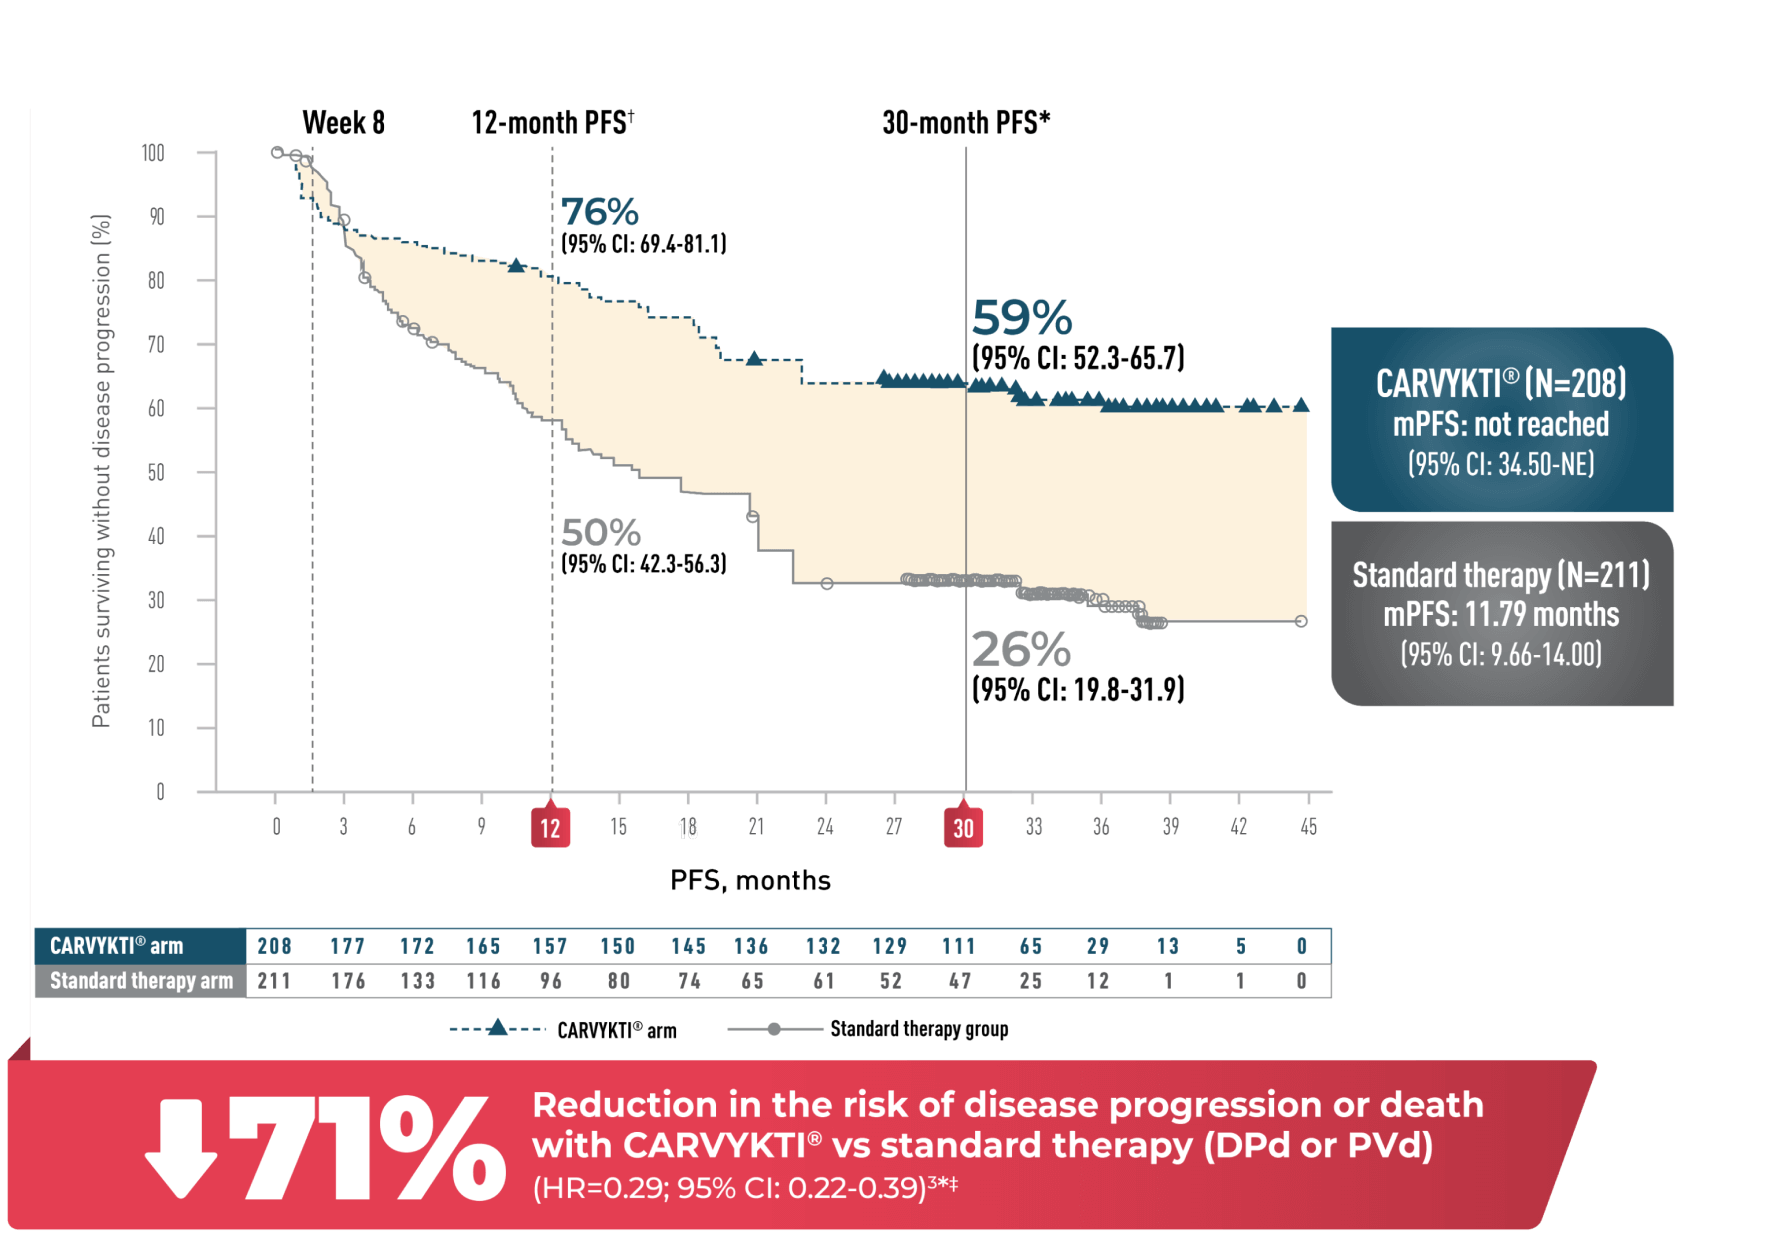
Progression-free survival
In CARTITUDE-4 at 33.6 months*
You are now viewing a subsequent follow-up analysis of the CARTITUDE-4 trial. This information is not included in the current USPI and should be interpreted with caution. The data are presented here for descriptive purposes only.
Progression-free survival1-4*
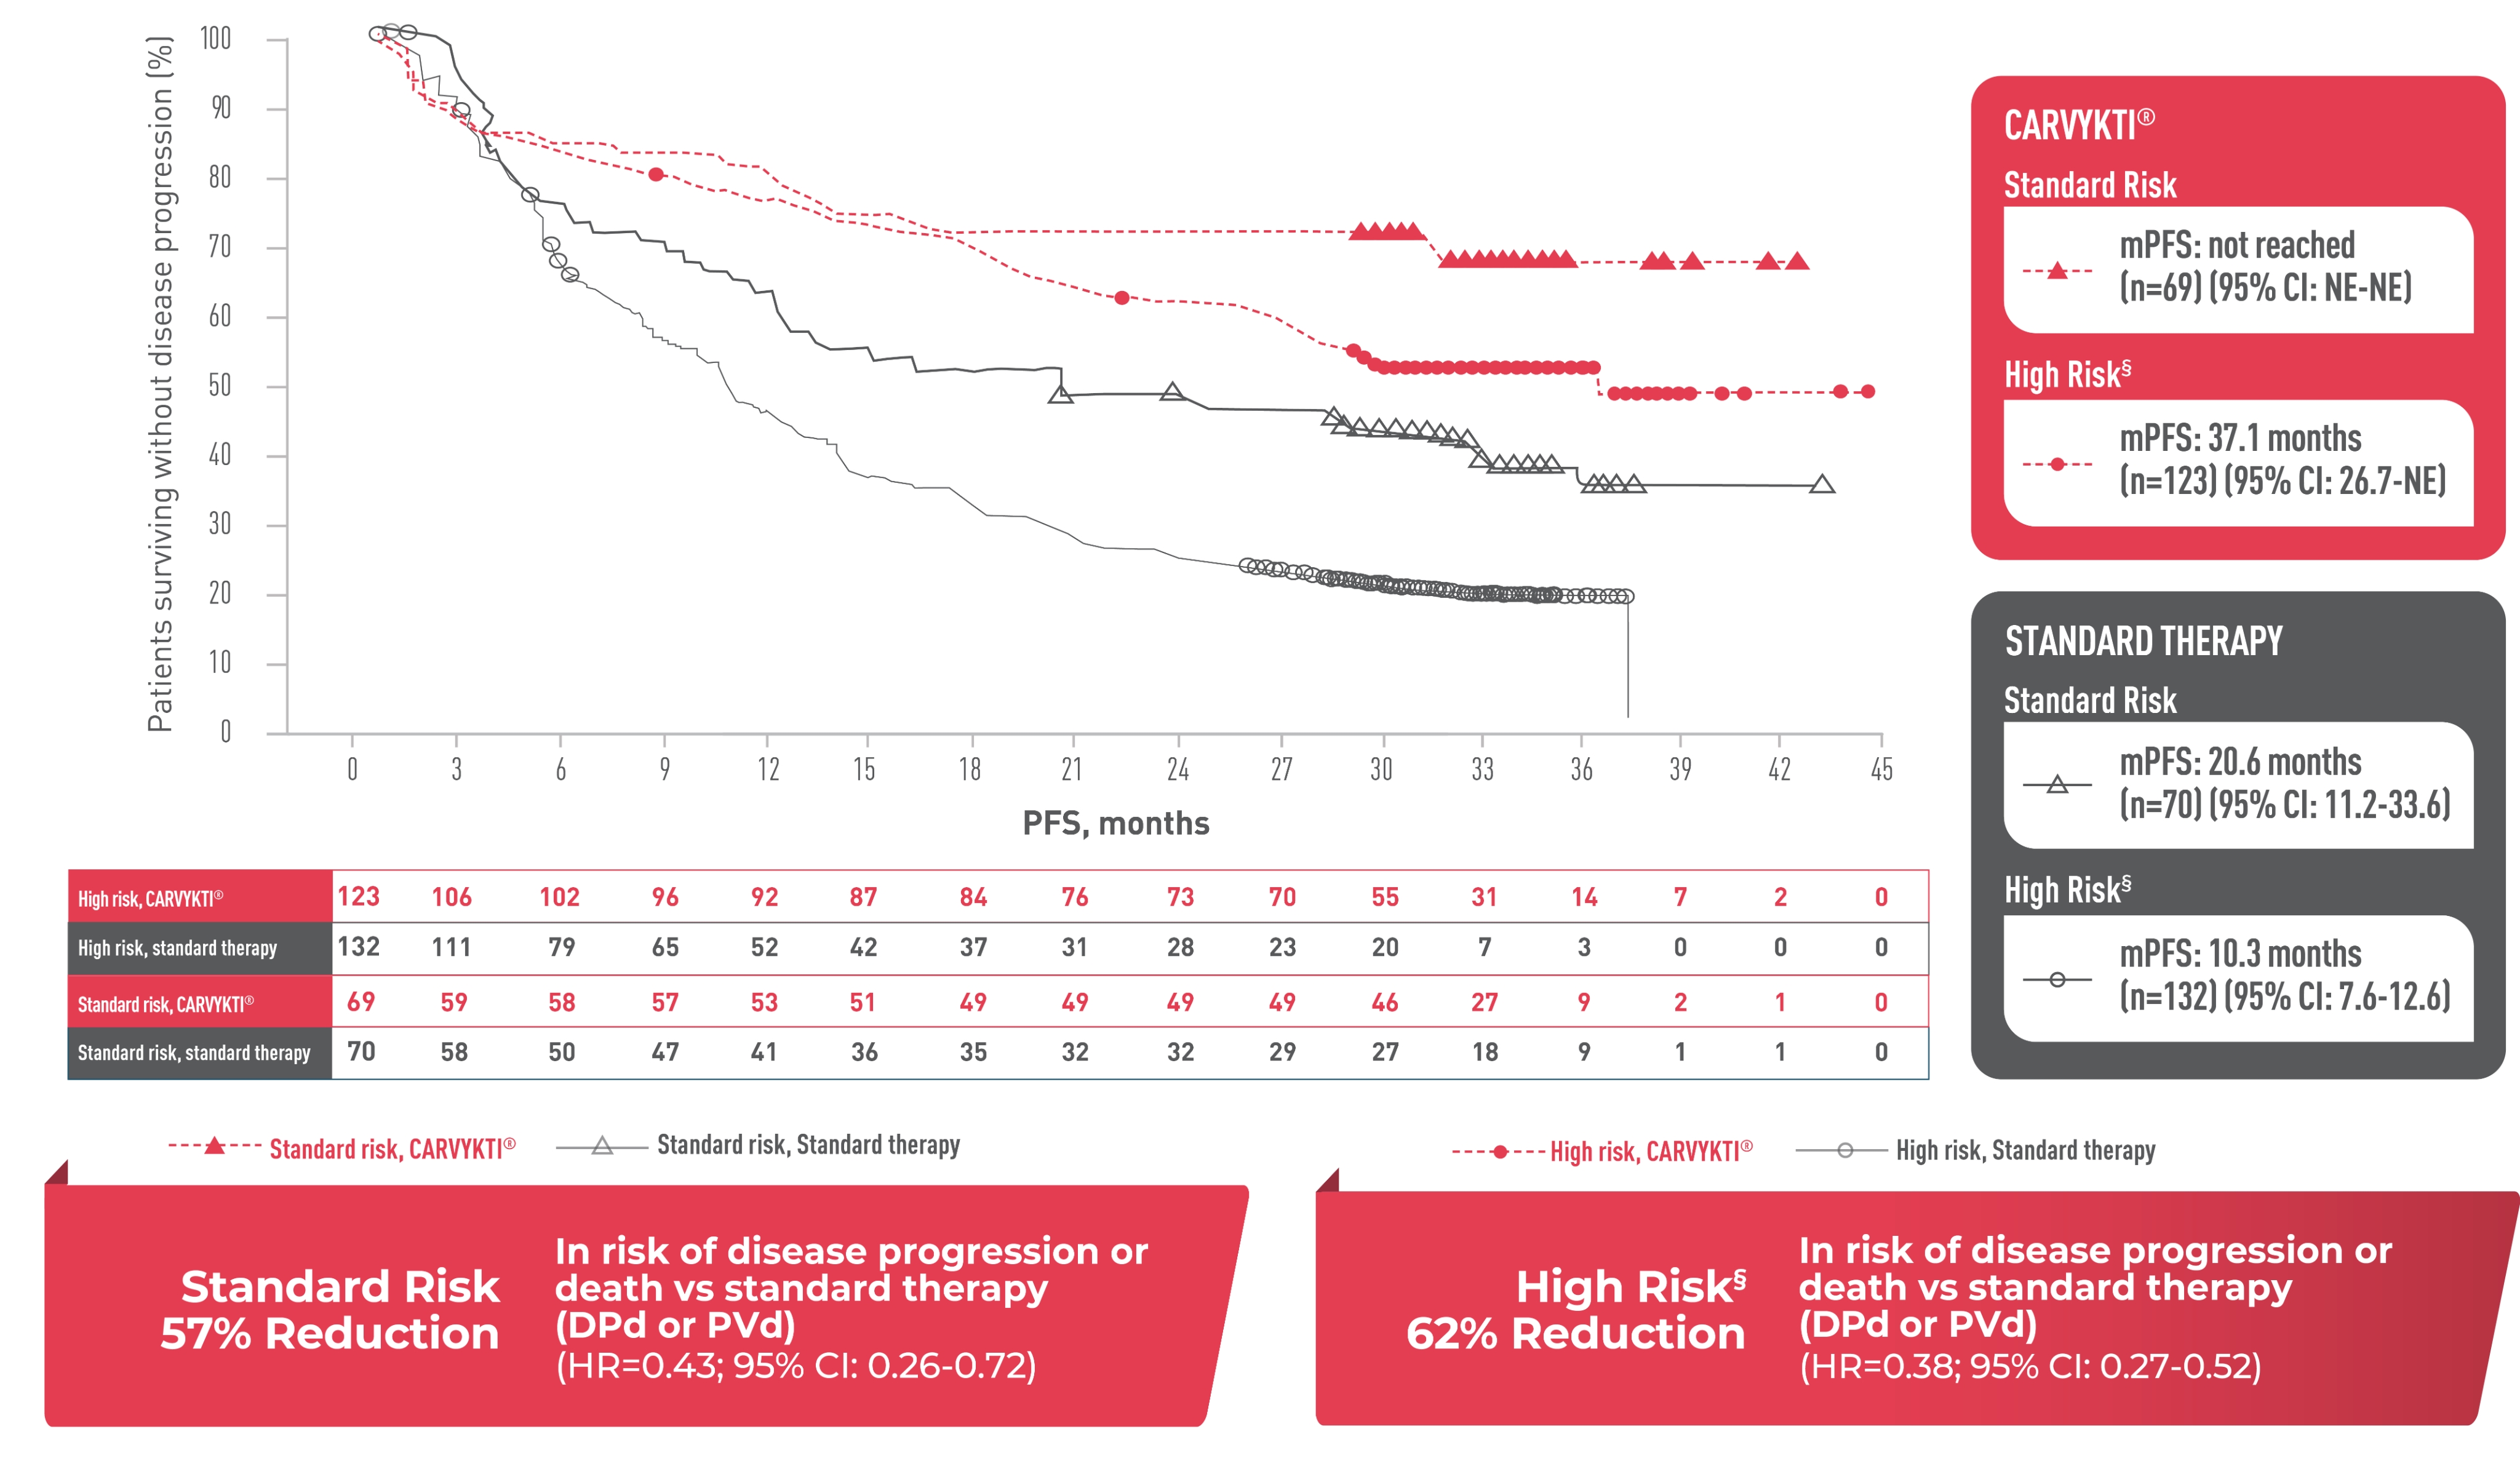
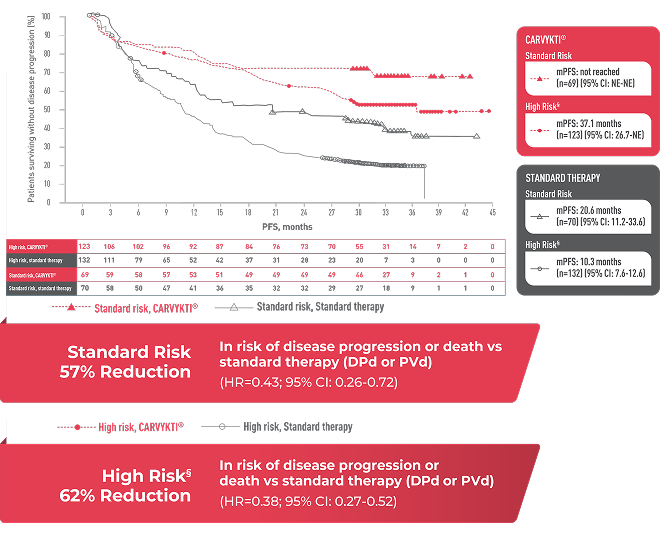
CARVYKTI® median PFS vs standard therapy (DPd vs PVd) across cytogenetic risk group at 33.6 months5*
The following data are based on a post hoc analysis of the primary data from the CARTITUDE-4 trial and therefore should be considered exploratory. The clinical significance is unknown. This information is not included in the current USPI and presented for descriptive purposes only.
Progression-free survival5*
CI=confidence interval; del=deletion; DPd=daratumumab, pomalidomide, and dexamethasone; FDA=U.S. Food and Drug Administration; gain/amp=gain/amplification; HR=hazard ratio; KM=Kaplan-Meier; mPFS=median progression-free survival; NE=not estimable; PFS=progression-free survival; PVd=pomalidomide, bortezomib, and dexamethasone; t=translocation; USPI=US Prescribing Information.
*Median follow-up was 33.6 months in the Intent-to-Treat Analysis Set.
†12-month PFS values are derived from the USPI and are based on independent review committee (IRC) assessment of progression, FDA-requested analysis approach for PFS, and the 01 November 2022 data cutoff.
‡HR and 95% CI from a Cox proportional hazards model with treatment as the sole explanatory variable, including only PFS events that occurred >8 weeks post randomization.
§High-risk cytogenetics defined as del(17p), t(4;14), t(14;16), or gain/amp(1q) by fluorescence in situ hybridization.5
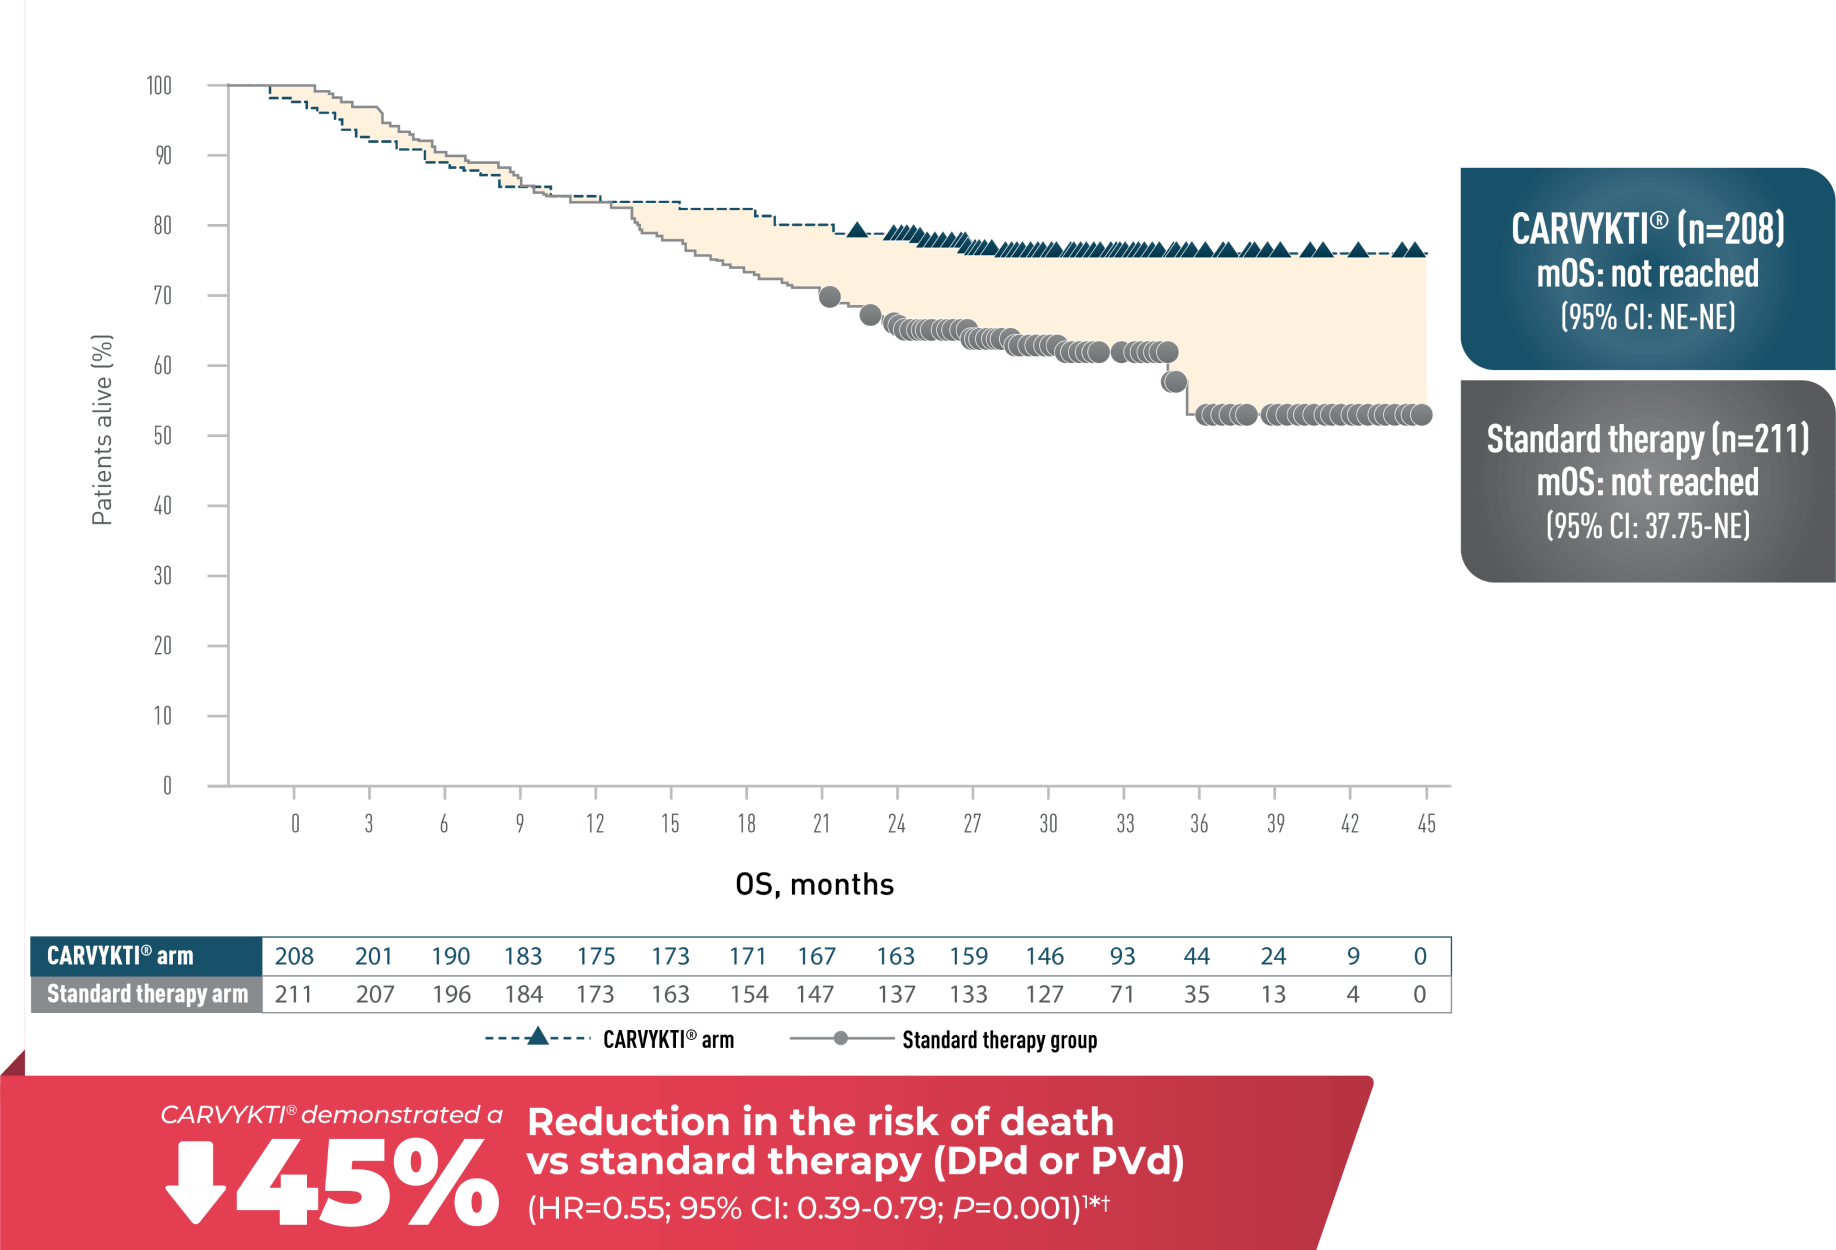
Overall survival
in CARTITUDE-4 at 33.6 months1
The only CAR-T with a proven long-term OS benefit in 2L+ RMMM1,2*
Overall survival1*†
Estimated OS rate at 12 months and 30 months*
You are now viewing a subsequent follow-up analysis of the CARTITUDE-4 trial. The overall survival at 12 and 30 months is not included in the USPI and should be interpreted with caution. The data are presented here for descriptive purposes only.
Overall survival1,3,4*†
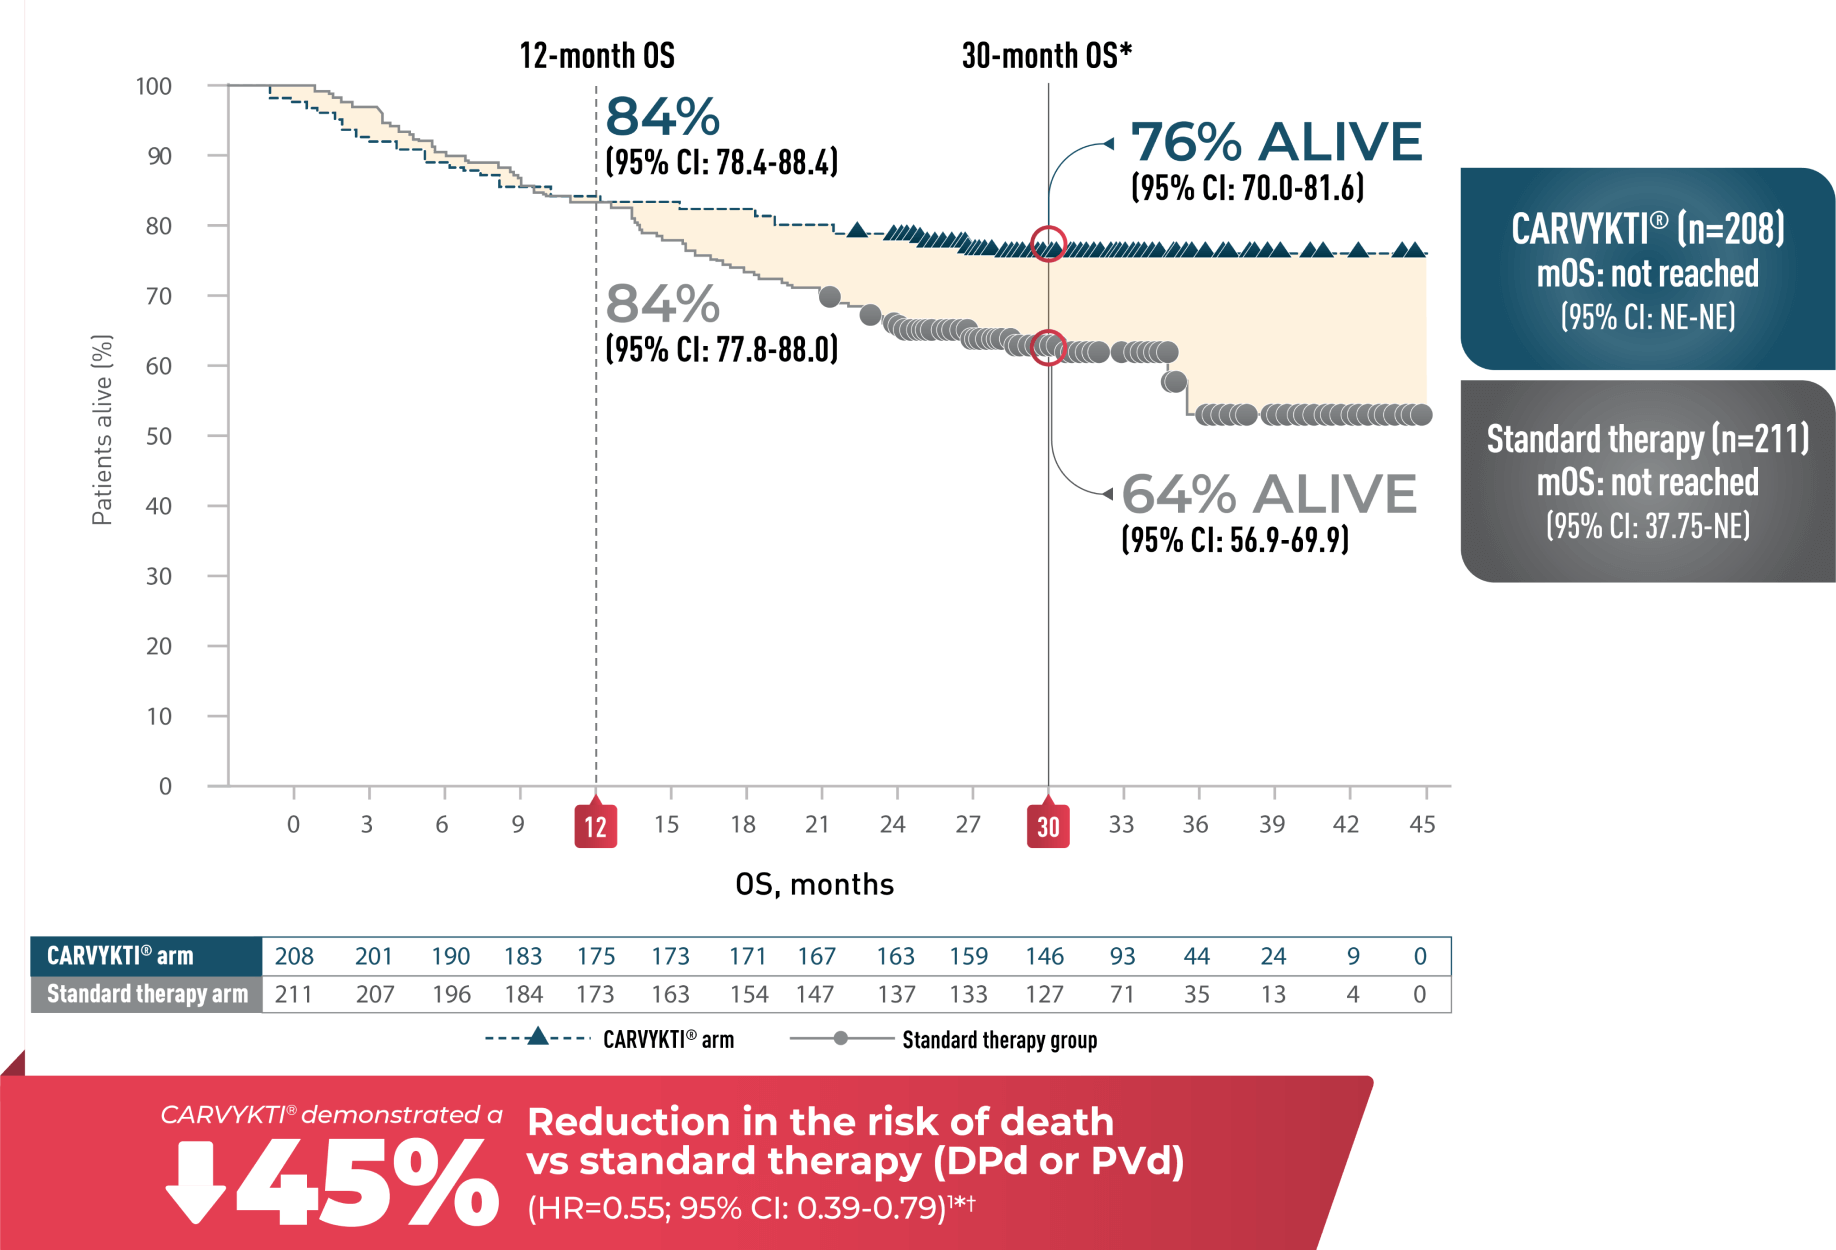
Percentages rounded to nearest whole number.
CARVYKTI® median OS vs standard therapy (DPd vs PVd) across cytogenetic risk groups at 33.6 months5*
You are now viewing a subsequent follow-up analysis of the CARTITUDE-4 trial. This information is not included in the current USPI and the clinical significance is unknown. The data are presented here for descriptive purposes only.
Overall survival5*
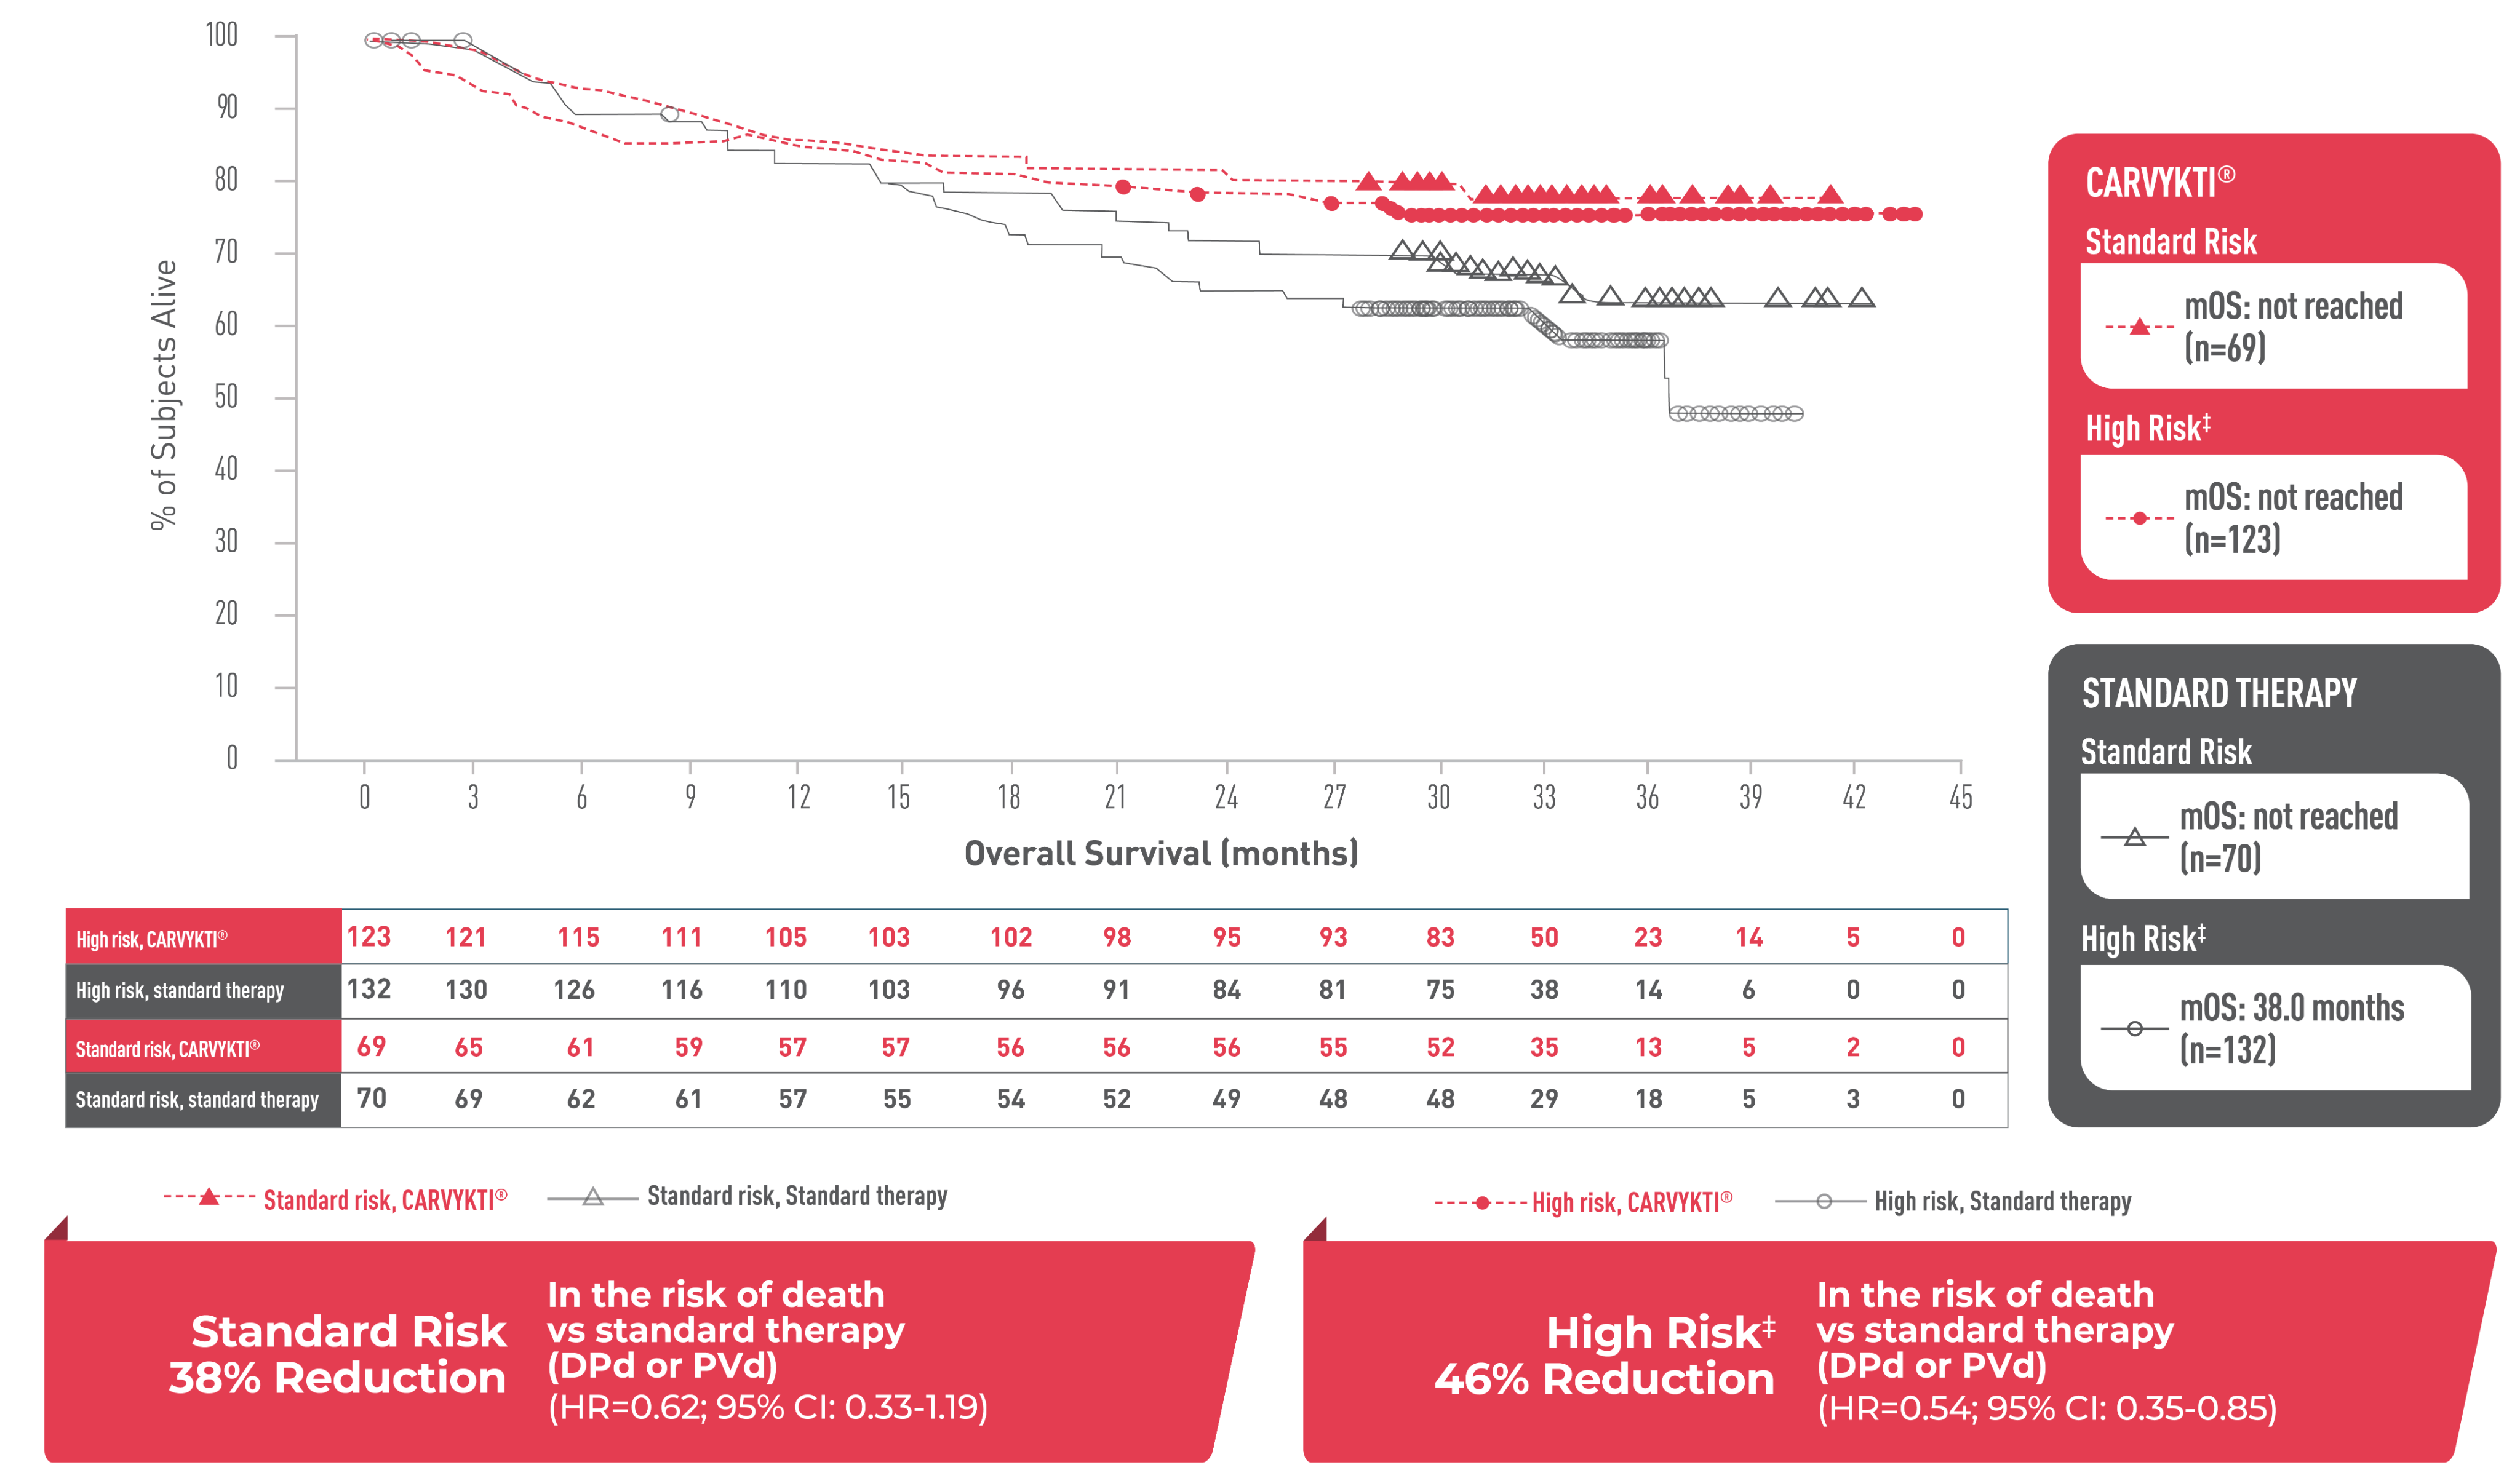
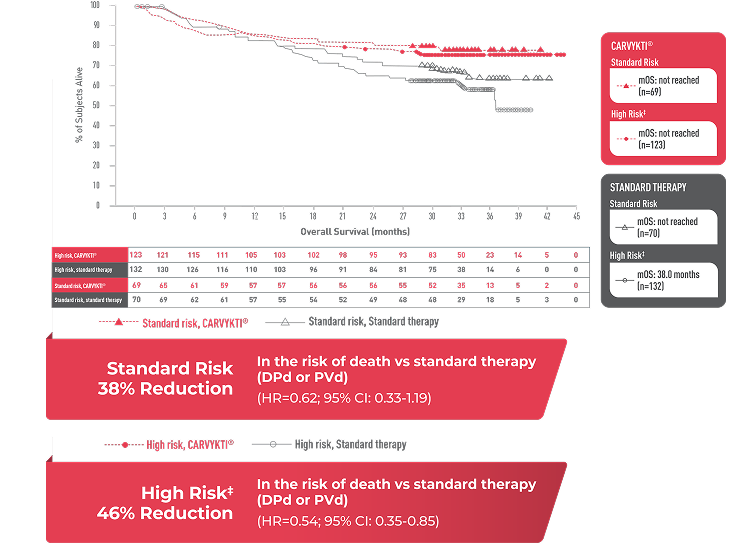
Percentages rounded to nearest whole number.
2L=second-line; CAR-T=chimeric antigen receptor-T cell; CI=confidence interval; del=deletion; DPd=daratumumab, pomalidomide, and dexamethasone; gain/amp=gain/amplification; HR=hazard ratio; KM=Kaplan-Meier; mOS=median overall survival; NE=not estimable; OS=overall survival; PFS=progression-free survival; PVd=pomalidomide, bortezomib, and dexamethasone; RRMM=relapsed or refractory multiple myeloma; t=translocation; USPI=US Prescribing Information.
*Median follow-up was 33.6 months in the Intent-to-Treat Analysis Set.
†Hazard ratio and 95% CI from a Cox proportional hazards model with treatment as the sole explanatory variable, including only PFS events that occurred >8 weeks post-randomization.
‡High-risk cytogenetics defined as del(17p), t(4;14), t(14;16), or gain/amp(1q) by fluorescence in situ hybridization.6
Overall response rate
In CARTITUDE-4 at 33.6 Months*†
You are now viewing a subsequent follow-up analysis of the CARTITUDE-4 trial. This information is not included in
the current USPI and should be interpreted with caution. The data are presented here for descriptive purposes only.
the current USPI and should be interpreted with caution. The data are presented here for descriptive purposes only.
Overall response rate1,2*†
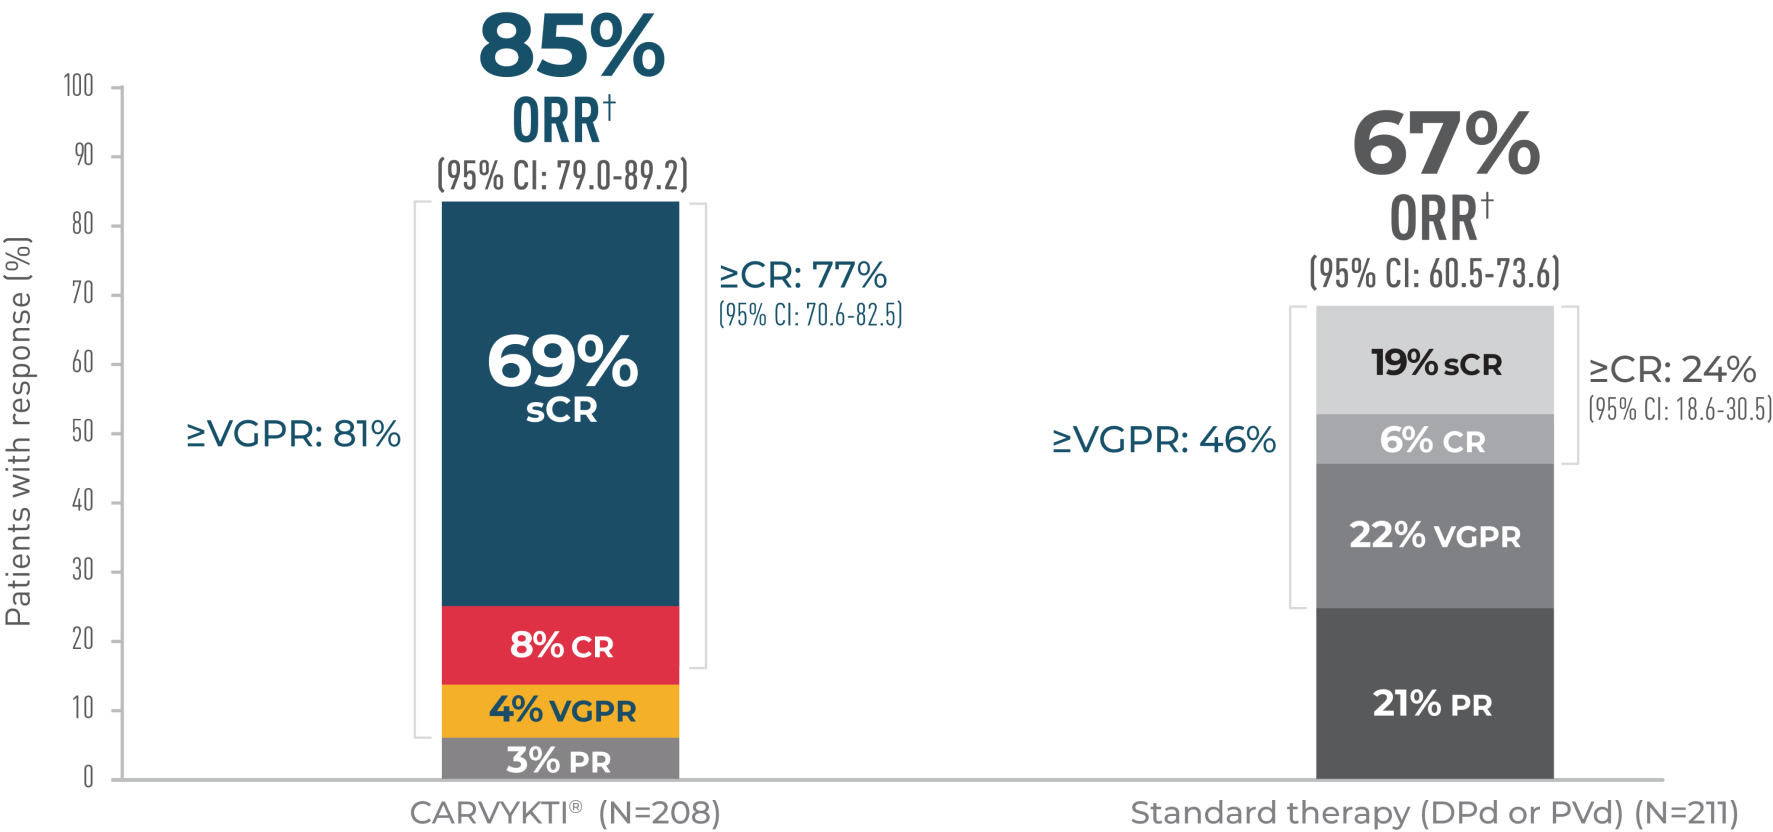
Percentages rounded to nearest whole number and may not add up due to rounding.
CI=confidence interval; CR=complete response; DPd=daratumumab, pomalidomaide, and dexamethasone; IMWG=International Myeloma Working
Group; ORR=overall response rate; PR=partial response; PVd=pomalidomide, bortezomib, and dexamethasone; sCR=stringent complete response;
USPI=US Prescribing Information; VGPR=very good partial response.
*Median follow-up was 33.6 months in the Intent-to-Treat Analysis Set.
†Assessed using a validated computerized algorithm; ORR is defined as the proportion of subjects who achieve a PR or better per IMWG criteria.
Duration of response
In CARTITUDE-4 at 33.6 Months*
You are now viewing a subsequent follow-up analysis of the CARTITUDE-4 trial. This information is not included in
the current USPI and should be interpreted with caution. The data are presented here for descriptive purposes only.
the current USPI and should be interpreted with caution. The data are presented here for descriptive purposes only.
Median duration of response1†
CI=confidence interval; DPd=daratumumab, pomalidomide, and dexamethasone; mDOR=median duration of response; NE=not estimable; PVd=pomalidomide, bortezomib, and dexamethasone; USPI=US Prescribing Information.
*Median follow-up was 33.6 months in the Intent-to-Treat Analysis Set.
†Analyzed among responders.
‡Estimated mDOR.
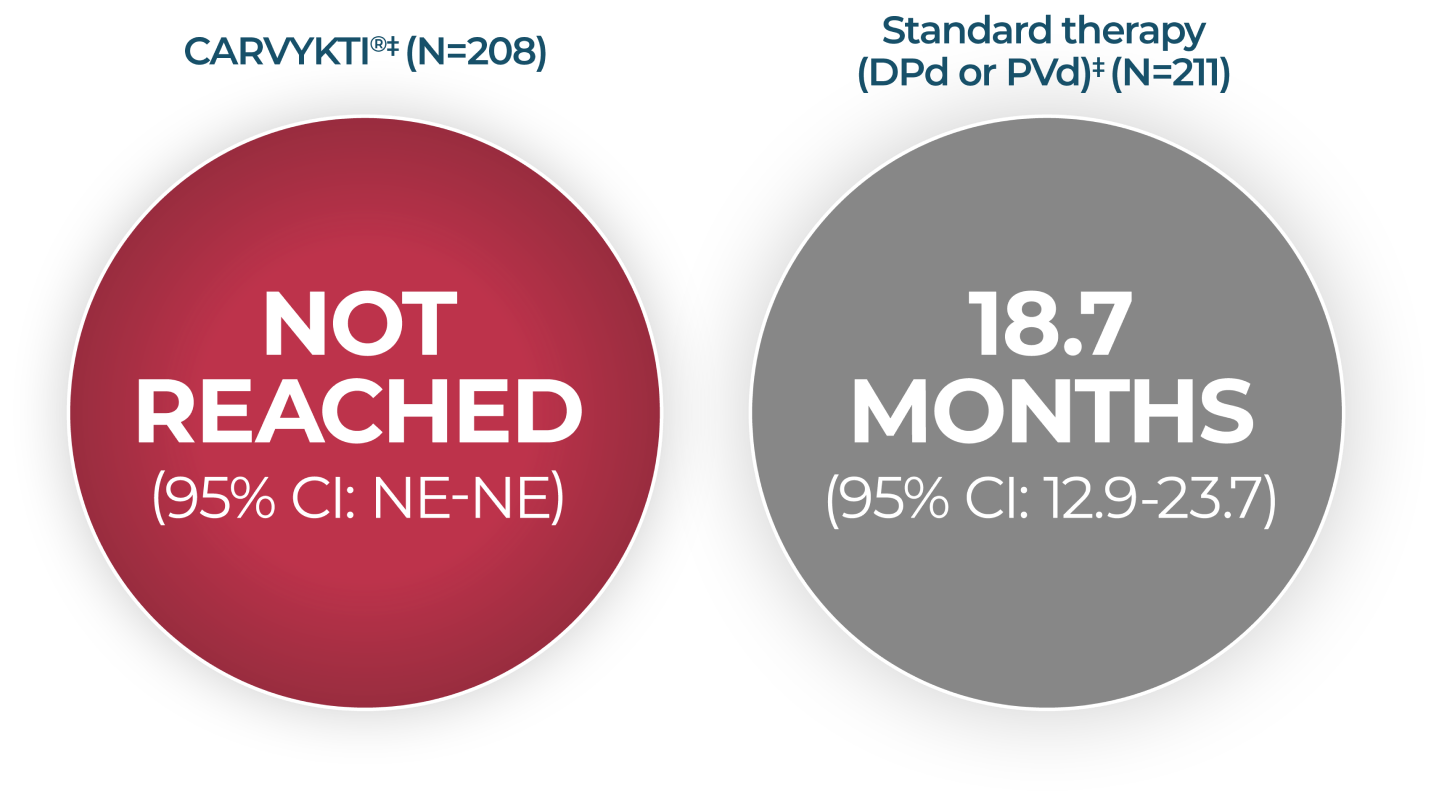
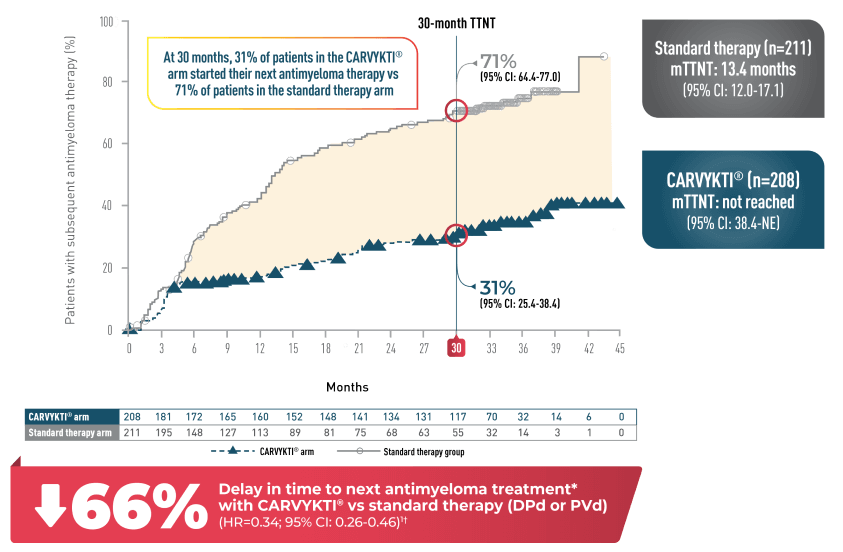
Time to next treatment (TTNT)
in CARTITUDE-4 at 33.6 months*
You are now viewing a post-hoc analysis of the CARTITUDE-4 trial. This information is not included in the current USPI and should be interpreted with caution. The data are presented here for descriptive purposes only.
Time to next antimyeloma therapy1*
Percentages rounded to nearest whole number.
CI=confidence interval; DPd=daratumumab, pomalidomide, and dexamethasone; HR=hazard ratio; NE=not estimable;
mTTNT=median time to next treatment; PVd=pomalidomide, bortezomib, and dexamethasone; USPI=US Prescribing Information.
*Median follow-up was 33.6 months in the Intent-to-Treat Analysis Set.
†Or death due to progressive disease.
Learn more about CARVYKTI®